Utilizing data from smart water meters
We are conducting research on methods for detecting changes in the lifestyle patterns of single-person elderly households.
In recent years, the number of single-person households has been increasing as the aging rate has increased. As the number of elderly single-person households increases, solitary death has become a social issue, and various monitoring services are being provided. It is believed that early detection and notification of frailty, a condition that is between a healthy person and a person in need of care, can prompt prompt treatment and lead to the resolution of social problems.
Against this background, our company is conducting research with the aim of building a mechanism to detect frailty using hourly water usage data obtained from smart water meters.
As a preliminary study of frailty detection, we focused on ``detecting changes in lifestyle patterns using water usage data,'' and decided to base our method on the following ideas.
・Water usage data is closely related to daily life and is an index that is only generated artificially, so it is suitable for analyzing lifestyle patterns.
・There is a relationship between frailty and changes in lifestyle patterns.
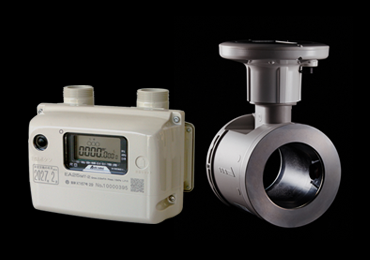
Additionally, this research uses water usage data obtained from a demonstration experiment conducted with the cooperation of the Urban Policy Division of Kakegawa City, Shizuoka Prefecture. In the demonstration experiment, smart water meters were installed at each customer's home and data on water usage was collected while the customers were leading their daily lives.
Detection method
In this study, based on the idea that there is a relationship between changes in lifestyle patterns and frailty, we investigated a method to detect whether there is a change in lifestyle patterns from water consumption data of consumers.
Since water usage data is related to the consumer's lifestyle pattern, by comparing the lifestyle pattern of period A obtained from the water usage data of the same consumer with the lifestyle pattern of period B and checking whether there are any changes. , we worked on "detecting changes in lifestyle patterns using water usage data."
Even for consumers (hereinafter referred to as health consumers) who have not reported any changes in their physical condition such as hospitalization and who are expected to have no change in their lifestyle patterns, they do not repeat the exact same lifestyle every day. Even when we compared water usage data for health consumers on a daily basis, we found that there were differences from day to day, and it was difficult to directly extract lifestyle patterns from the collected water usage data.
Based on this background, in order to detect whether there is a change in lifestyle patterns, it is necessary to convert water usage data into data that can extract lifestyle patterns, and then mechanically determine changes in lifestyle patterns from the converted data. We believe that a two-step process is necessary.
Step 1: Processing of converting water usage data into data that can extract lifestyle patterns. [Conversion process]
Step2: Processing that mechanically determines changes in lifestyle patterns using the converted data. 【Determination process】
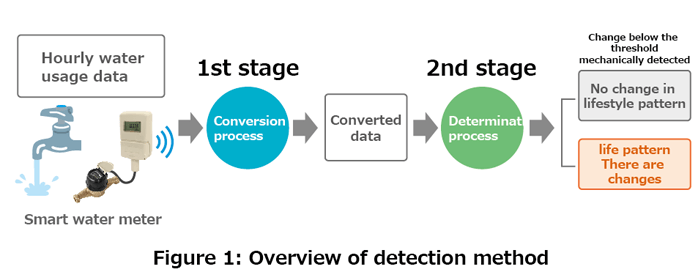
This section explains the conversion process (first stage) and judgment process (second stage).
① Conversion processing
This process converts water usage data into data from which lifestyle patterns can be extracted.
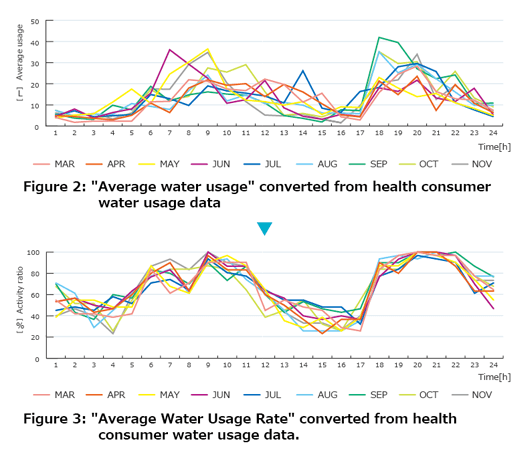
First, we considered a conversion process called "average water usage" that averages water usage data for each time period on a monthly basis, but "average water usage" has large variations from month to month (seasonal). I know it's coming out. This variation was also seen in the "average water usage" converted from water usage data of health consumers. (See Figure 2), we thought that to extract lifestyle patterns, we needed data that had been converted more appropriately than just "average water usage."
As a result of trying various data conversions for the water usage data, we calculated the percentage of days when the amount of water used above a certain threshold A was calculated for each time period per month, and calculated the "average We have devised a conversion method called ``Water Utilization Rate''. (Patent applied for)
Unlike the "average water usage", the "average water usage rate" converted from the water usage data of health consumers can now provide results that do not show monthly variations. (See Figure 3)
Therefore, we were able to confirm that the ``average water usage rate'' is suitable for extracting lifestyle patterns. Therefore, we decided to use the "average water usage rate" in the judgment process explained below.
② Judgment processing
This process determines whether the average water usage rate has changed.
If you compare the graphs in Figure 3 (no change) and Figure 4 (change), you will find that the graph in Figure 3 seems more organized.
The judgment process mechanically judges what humans intuitively feel (if there is variation, there is a change; if there is consistency, there is no change). (Patent applied for)
Since the average water usage rate is an extraction of lifestyle patterns, we decided to determine whether there is a change in lifestyle patterns by looking at changes in the average water usage rate.

To see changes in the average water usage rate, you need to look at changes in the vertical axis (amplitude) and horizontal axis (phase) of the graph. In this study, we adopted the following two indicators to measure change.
Indicator 1: Correlation degree calculated using "Pearson's product moment correlation coefficient definition formula", which is known as a general correlation coefficient
Reason for adoption: Excellent at detecting phase changes in data
Indicator 2: Similarity calculated using the "dynamic time warping method," which is a known method for calculating the similarity of time series data.
Reason for adoption: Excellent at detecting amplitude changes in data
Figure 5 shows the flow of determining changes from the average water usage rate using these indicators.
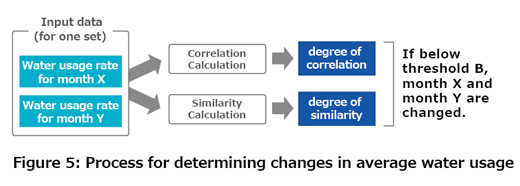
Comparing the metric to threshold B determines whether the average water usage rate has changed.
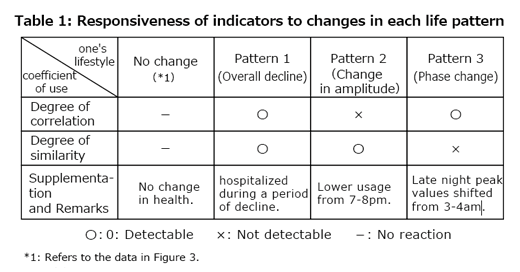
In this study, we examined whether changes in the three types of lifestyle patterns shown in Figure 4 could be detected by comparing the months in which changes were observed, using correlation and similarity. For each pattern, the part indicated by the arrow represents the change. Also, each data shown in Figure 4 is from a different customer.
Using the judgment process shown in Figure 5, we compared the average water usage rates for two months.
In Figure 4, each line of a different color corresponds to the average water usage rate for one month, so lines of different colors are compared.
The results are summarized in Table 1. By using indicators that measure the degree of correlation and similarity, we were able to confirm that it is possible to mechanically detect and judge changes in lifestyle patterns from water usage data.
Since there are patterns that may or may not be detected depending on the indicators, it is thought that a combined judgment using two indicators is better for detecting changes in lifestyle patterns.
Regarding ideas for calculating similarity
As explained in "② Judgment processing", the "dynamic time warping method" is used to calculate the similarity between two waveforms.
The "dynamic time warping method" calculates the distance between each point of two waveforms using brute force, and calculates the degree of similarity by finding the combination that minimizes the sum of distances among all patterns.
The larger the total distance between waveforms, the smaller the degree of similarity, and it is determined that there is a change in amplitude. Figure 6 shows the results of applying the dynamic time warping method to average water usage rate data 1 and 2 (hereinafter referred to as data 1 and data 2) for a certain customer.
This is a comparison of data 1 and data 2. The green frame represents the time period when the data were compared, and the dotted line represents the distance between the two data used to calculate the similarity.
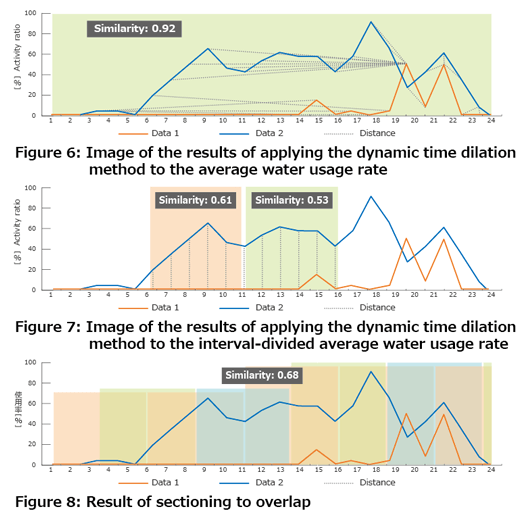
The amplitudes of data 1 and data 2 shown in Figure 6 clearly change, but when the dynamic time warping method is applied to the entire area (green frame section in Figure 6), the similarity between the two data exceeds the threshold. It turns out that I can't detect any changes. This is because the local change in data 2 around 19:00 causes the sum of the distances between the data to become smaller, making the degree of similarity larger than expected.
Therefore, we devised a method that divides the average water usage rate into regular time intervals and applies a dynamic time warping method to each interval.
Considering the case where there is a change in the amplitude of the average water usage rate at the boundary between sections, we set the sections so that they overlap. (Patented, see Figure 8)
By calculating the sum of distances between data for each set section, it is possible to exclude the influence of changes in the amplitude of local average water usage rates that exist in different sections, and to detect changes in amplitude appropriately. It seems possible.
After dividing the average water usage rate in Figure 6 into the sections above, we calculated the degree of similarity again according to Figure 4. The calculated similarity was below the threshold, confirming that it was possible to detect changes in the amplitude of data 1 and data 2.
Through the above efforts, we were able to confirm that it is possible to mechanically detect amplitude changes in average water usage rate data from the similarity calculated using the dynamic time warping method.
Researcher's voice
■What challenges and discoveries did you make in your research on lifestyle pattern change detection methods using smart water meter data?
As mentioned above, there was a problem in that it was difficult to extract lifestyle patterns using smart water meter data as is.
As a result of trial and error, we calculated not water usage data, but the percentage of days when water usage exceeded a certain threshold value, and converted the water usage data into an average water usage rate, which is calculated as the frequency of water usage, to improve lifestyle patterns. I discovered that it is possible to extract .
■Please let us know any further improvements or future improvements.
By observing and analyzing more data, we aim to improve the accuracy of detecting changes in lifestyle patterns, as well as detect changes in health status and the state (frailty) between healthy people and those in need of care. I would like to explore this.
Inquiries about research and development of the latest technologies
Aichi Tokei Denki Co.,Ltd.
Please contact us using the General Inquiry Form.
Share this article